Scientific Illustration of Atlantic Meridional Overturning Circulation (AMOC)
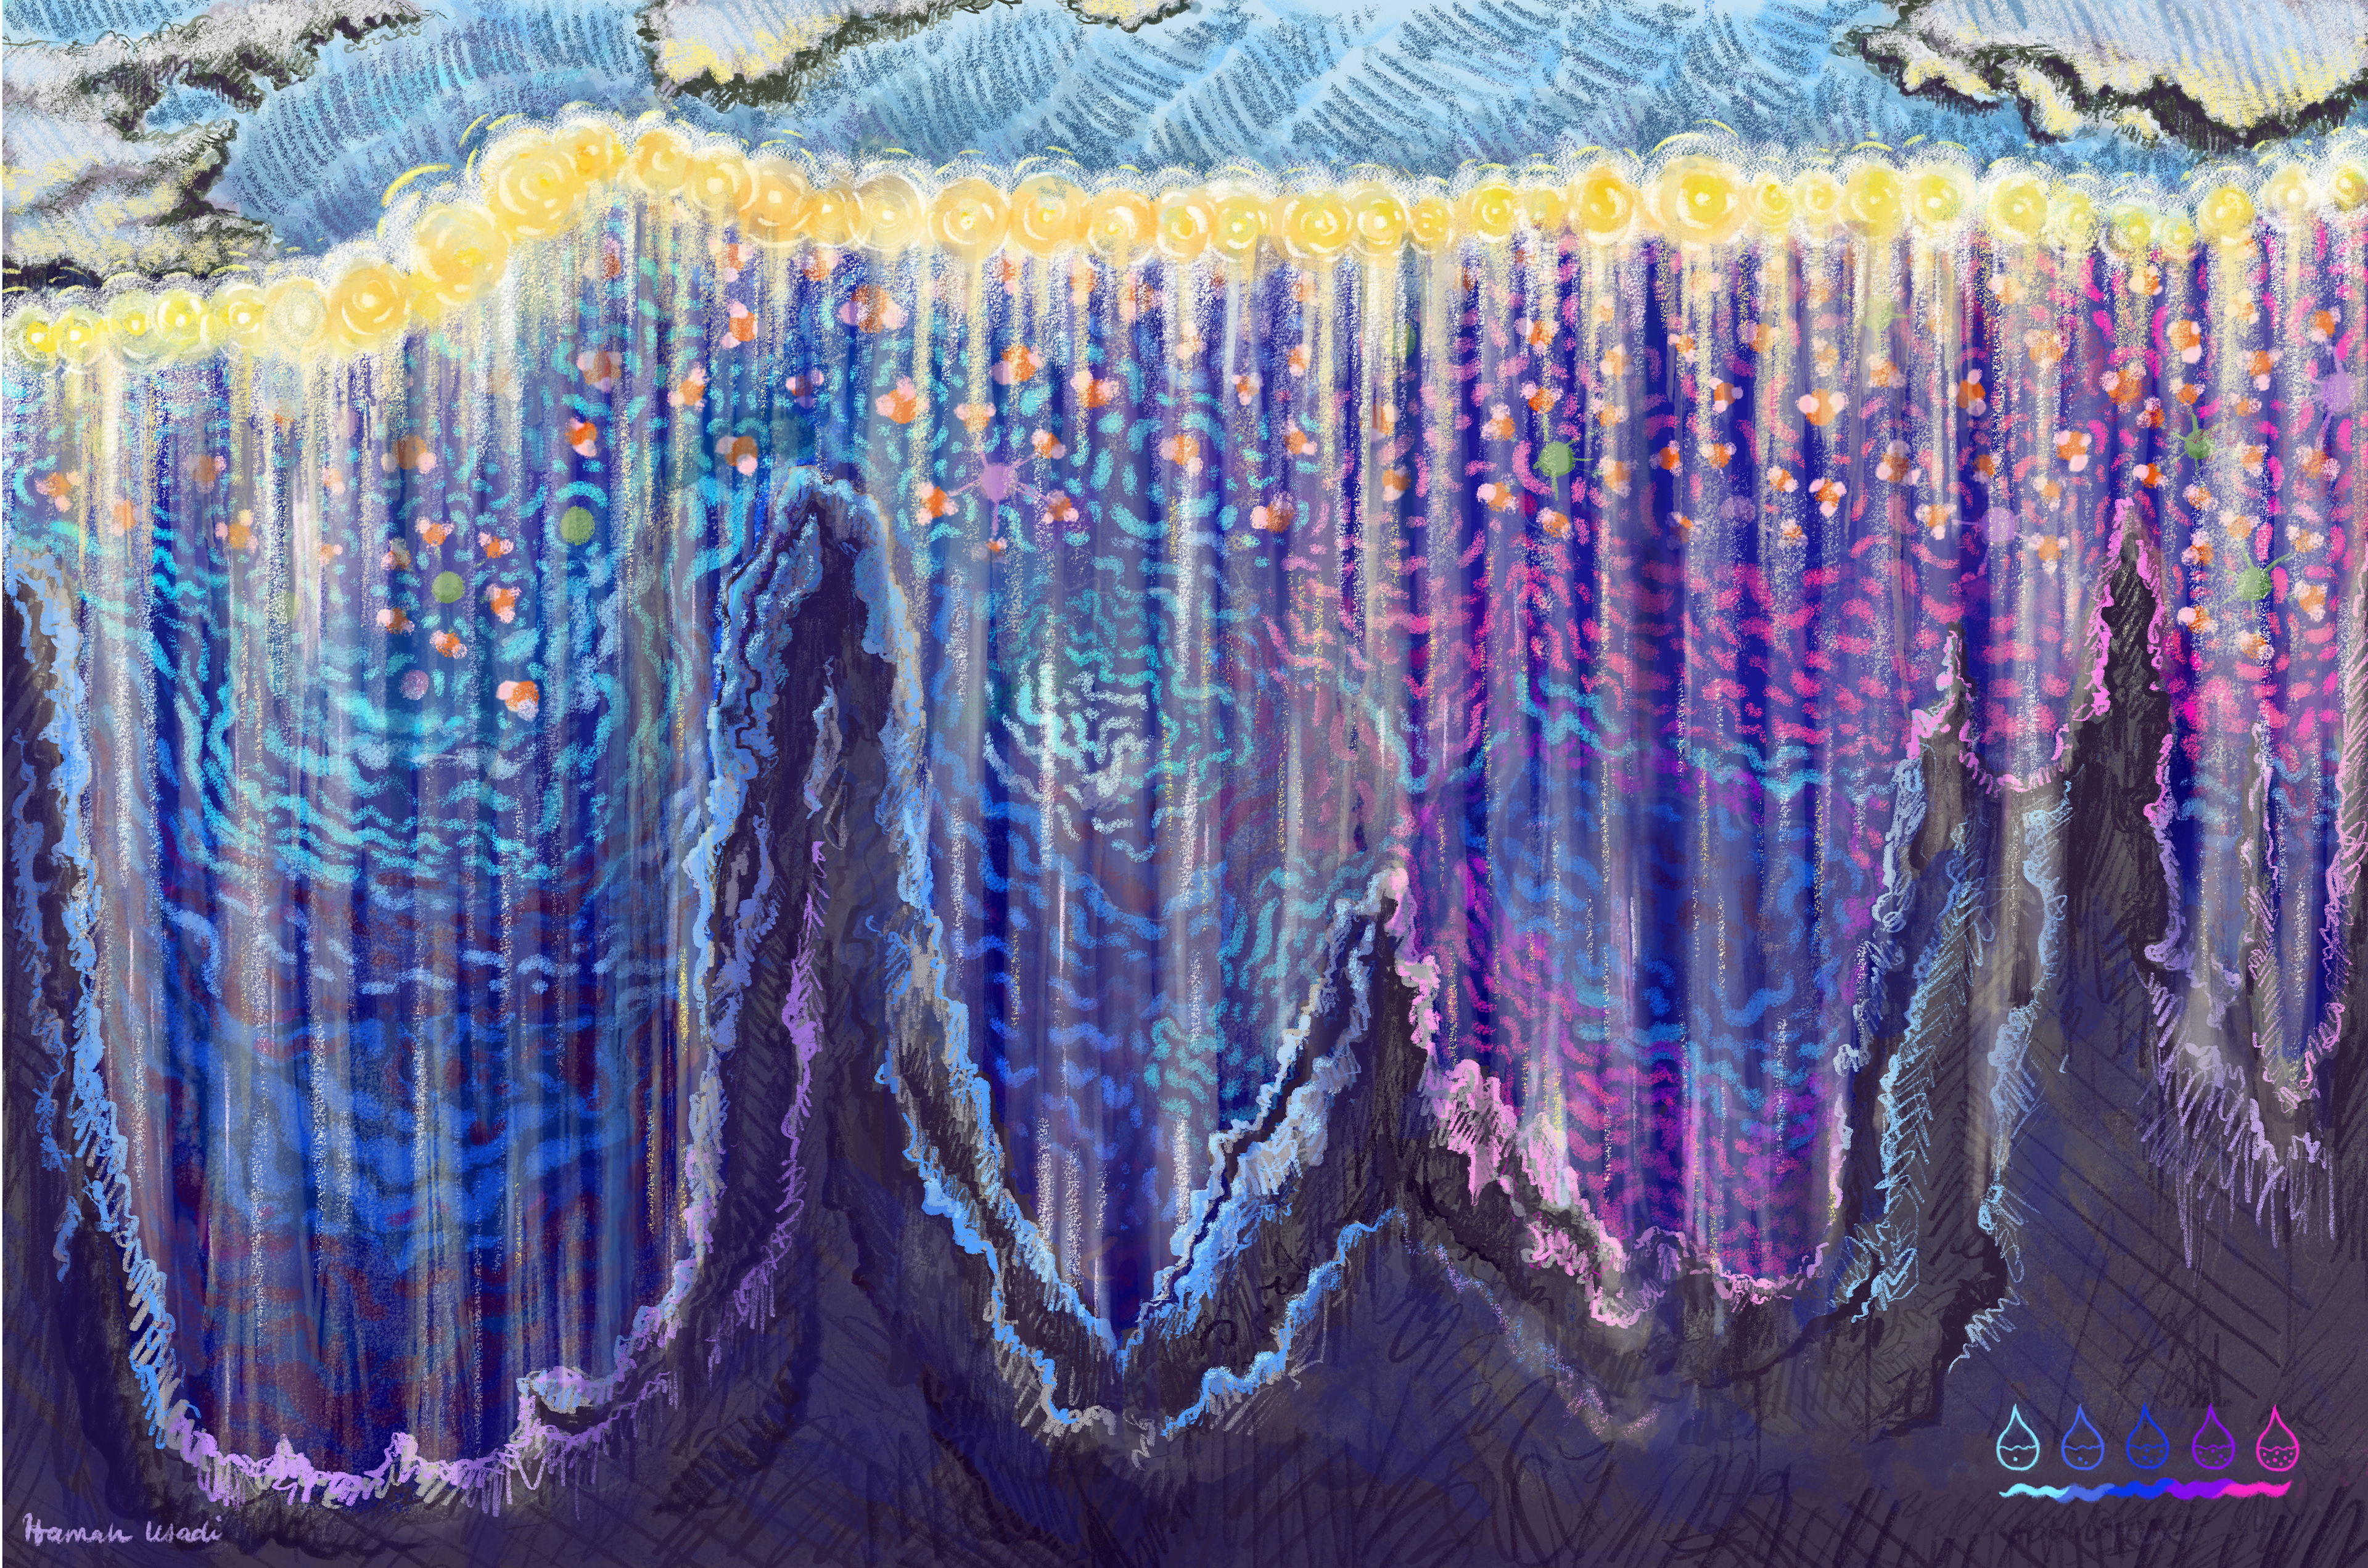
Commissioned illustration of the Atlantic Meridional Overturning Circulation (AMOC), created for oceanographer Susan Lozier and based on her research with the international OSNAP program.
The piece translates observations from the international Overturning in the Subpolar North Atlantic Program (OSNAP) into an illustrated cross-section of the North Atlantic. OSNAP is an observing system that stretches from Canada to Greenland and Greenland to Scotland, using instruments across the ocean to measure properties including temperature, salinity, and velocity. These measurements allow researchers to study the strength and structure of the Atlantic Meridional Overturning Circulation (AMOC).
The illustration is based on Figure 2B from Lozier et al. (2019), which maps salinity and density structure along the OSNAP observing line. I preserved the geography and underlying structure of the scientific figure while developing a new visual language for the data. Color represents changes in salinity, water molecules create movement and texture, and vertical beams mark OSNAP measurement locations. The beams cast light through the cross-section, representing how these instruments make conditions beneath the ocean surface visible.
Translating the Data
The source figure above contains several layers of information: bathymetry, salinity, density contours, and measurement locations. I separated these elements to determine what needed to remain scientifically accurate and what could be interpreted visually.
The final illustration retains the cross-section's bathymetry and salinity patterns while reducing the original rainbow scale to a blue, purple, and pink palette. Density contours remain as a secondary layer, while repeated molecular forms turn the continuous data field into a more physical representation of water.
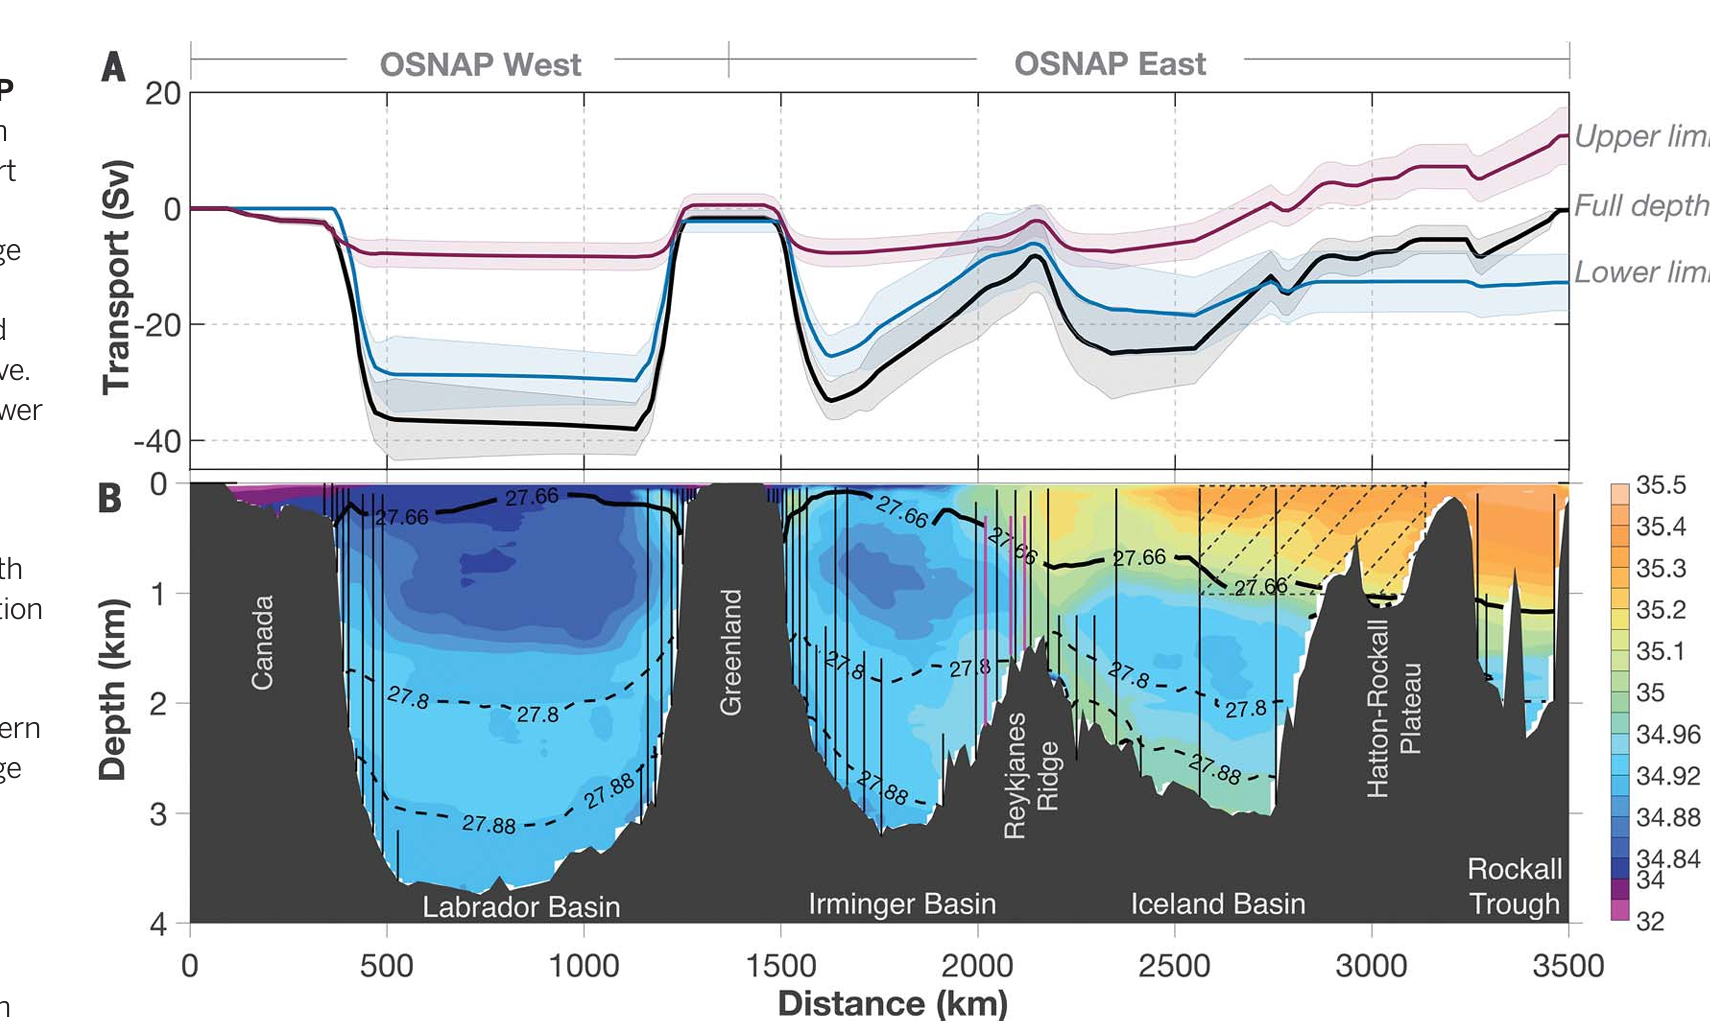
Source figure: Salinity and potential density across the OSNAP section. Figure 2B from Lozier et al. (2019).
Lozier, M. S., et al. (2019). “A Sea Change in Our View of Overturning in the Subpolar North Atlantic.” Science, 363(6426), 516–521. DOI: 10.1126/science.aau6592.
Ideation
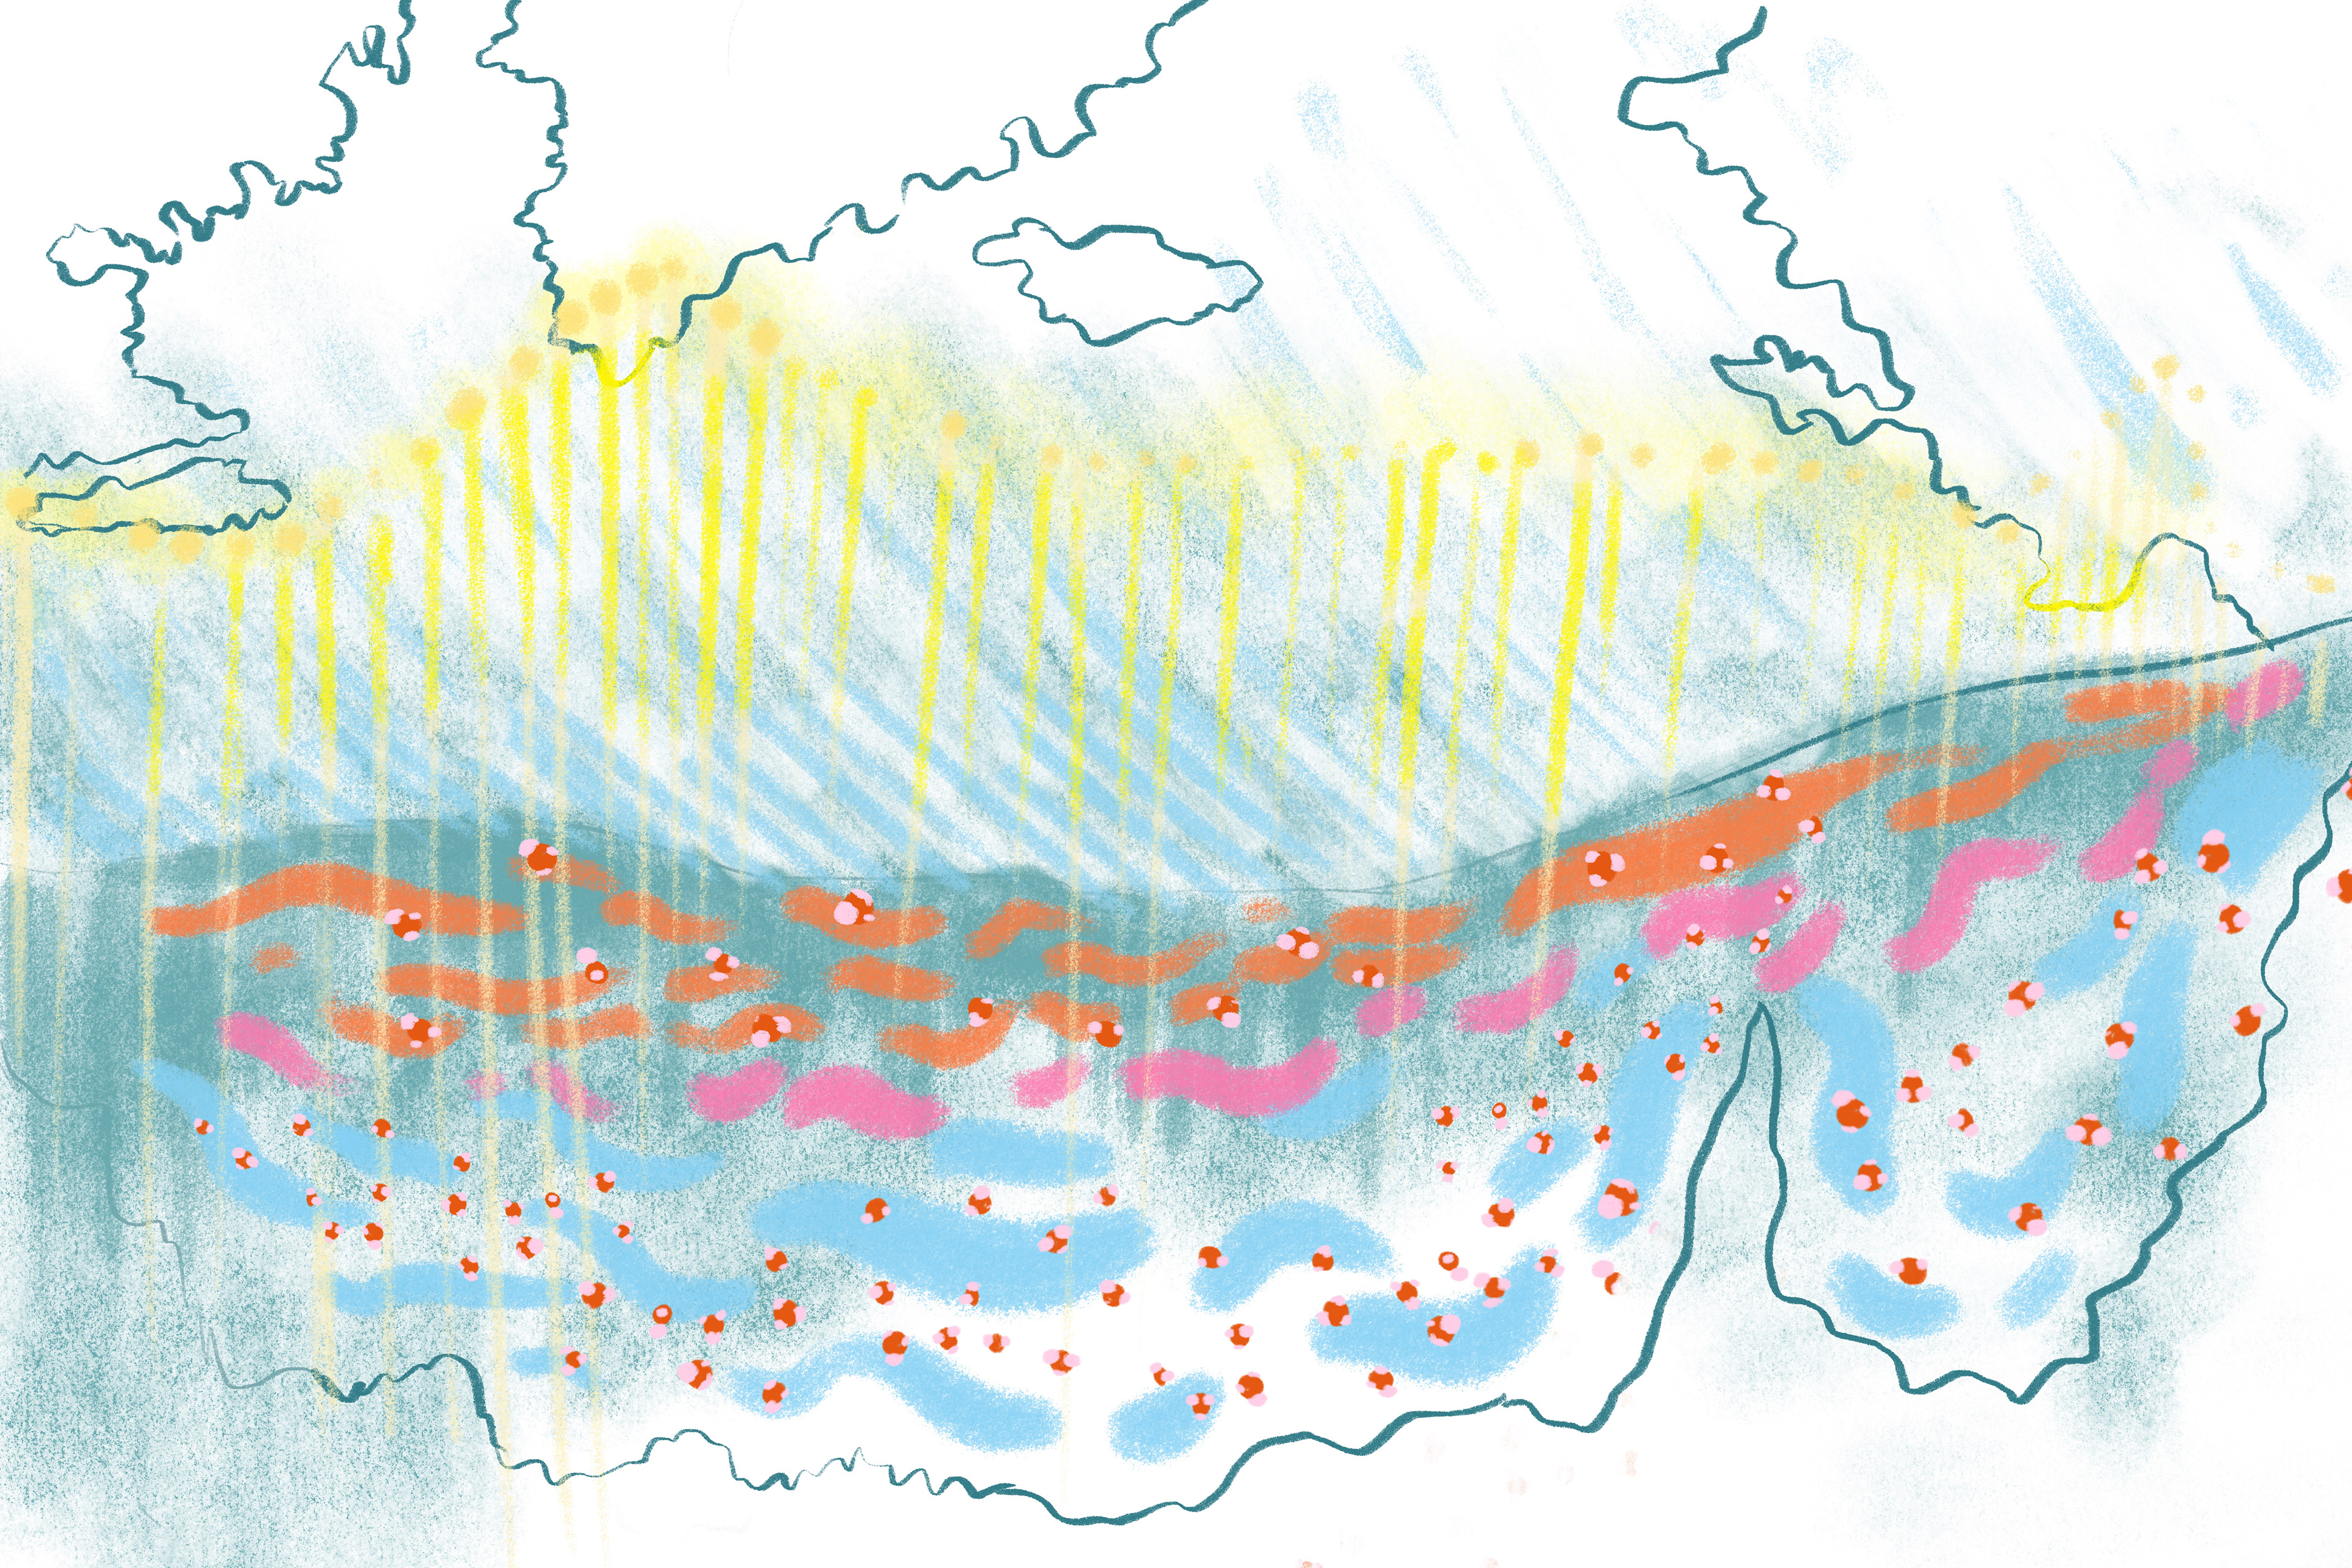
Initial concept sketch. I used the OSNAP measurement line as the organizing structure, placing the geographic view above the ocean cross-section. The vertical beams developed from the idea of the instruments “illuminating” conditions below the surface.
Artwork Details
Molecular forms reference the interaction of water with dissolved Na⁺ and Cl⁻ ions, while shifts from blue to purple and pink represent changes in salinity. OSNAP instruments appear at the surface, with vertical beams extending through the water column to connect the measurements above with the conditions they reveal below.

lower salinity areas are lighter blue
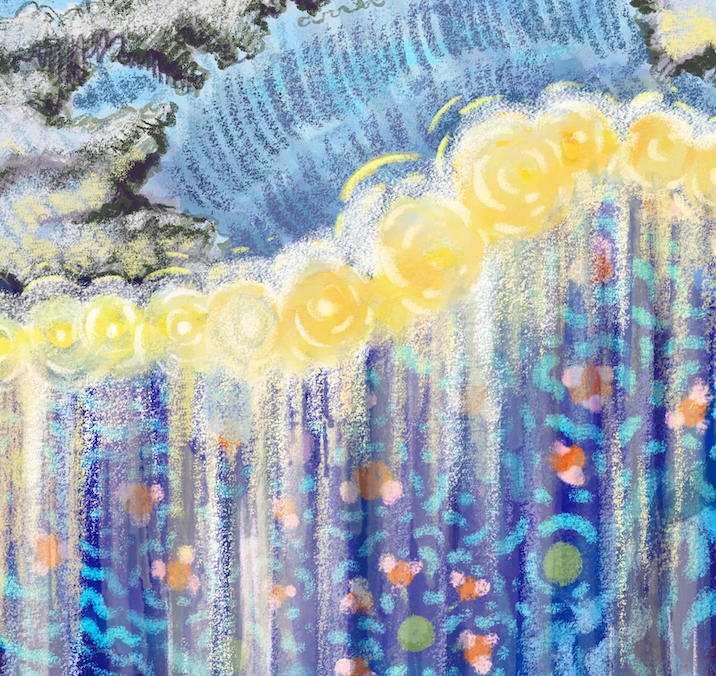
OSNAP sensors